Website Traffic-
18 January 2010 – 23
23 January 2010 – 33
29 January 2010 – 50
14 February 2010 – 80
Total traffic as of 14th February 2010 is 23 plus 33 plus 50 plus 80 equals 186. This is only for 4 days. What if you want to see your total traffic from day 1 up to 23 December 2012?
Do you add them all up together one by one?
23 plus 33 plus 50 plus 80 plus 216 plus 312 plus 334 plus 490… and the equation goes on and on.
Maybe most of you used to do this earlier when there weren’t any other options. If some of you are still doing this, this article would be great for you.
Perhaps most of you are already using tools to measure your website traffic and get insights on your users. This article does exactly this. I’ll explain to you some of the tools and metrics you can use to measure the growth of your website.
Without further ado, let us begin!
Google Analytics

Brief Introduction to Google Analytics (GA)
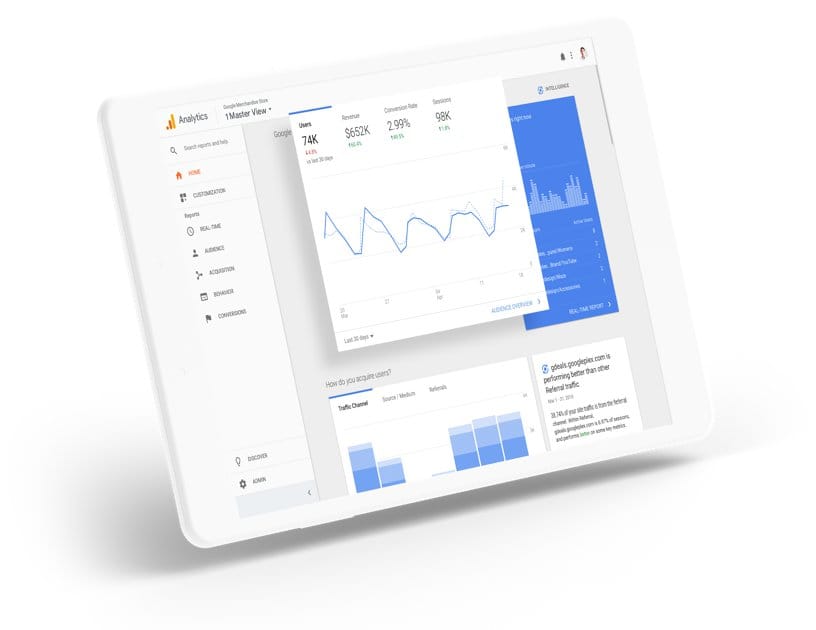
Google Analytics is a web analytics service offered by Google. The standard version is free, so sign up now if you haven’t.
Now, what does GA analyzes?
GA gives you insights about your website traffic and it has 5 main reports. We’ll go into them in the next part “Metrics Google Analytics Can Measure”.
The best thing about GA is that you do not need to collect data about your website manually (if there is a way to do so). All crucial and actionable data are presented to you when you log in to GA.
Let’s look at the crucial and actionable data presented by GA.
Metrics Google Analytics Can Measure
So, the five main reports are Realtime, Audience, Acquisition, Behavior, and Conversion. Each report except conversion has an overview tab.
1. Realtime
This report gives you realtime information on where the traffic is coming from, consisting of geographical locations, social platforms, referrals, and keywords entered on the search engine.
It also tells you which page is currently being visited and current events happening on your page.
2. Audience
The “Audience” report gives you information about your website visitors. It tells you the following:
I. the number of active visitors
Ii. the demographics of your visitors
Iii. the interest of your visitors
Iv. the geographics of your visitor
V. the behavior of your visitors
Vi. technology used
Vii. user flow
3. Acquisition
The “Acquisition” report is equally as important compared to the “Audience” report. The acquisition report lets you know how your visitors ended up on your website.
4. Behavior
The “Behavior” report tells you how your visitors act on your page. Are they staying on your long enough? Do you have a steady increase in traffic over time? Which is your best-performing page?
You’ll also be able to now the overall speed your page loads. You can narrow it down to specific pages as well.
5. Conversion
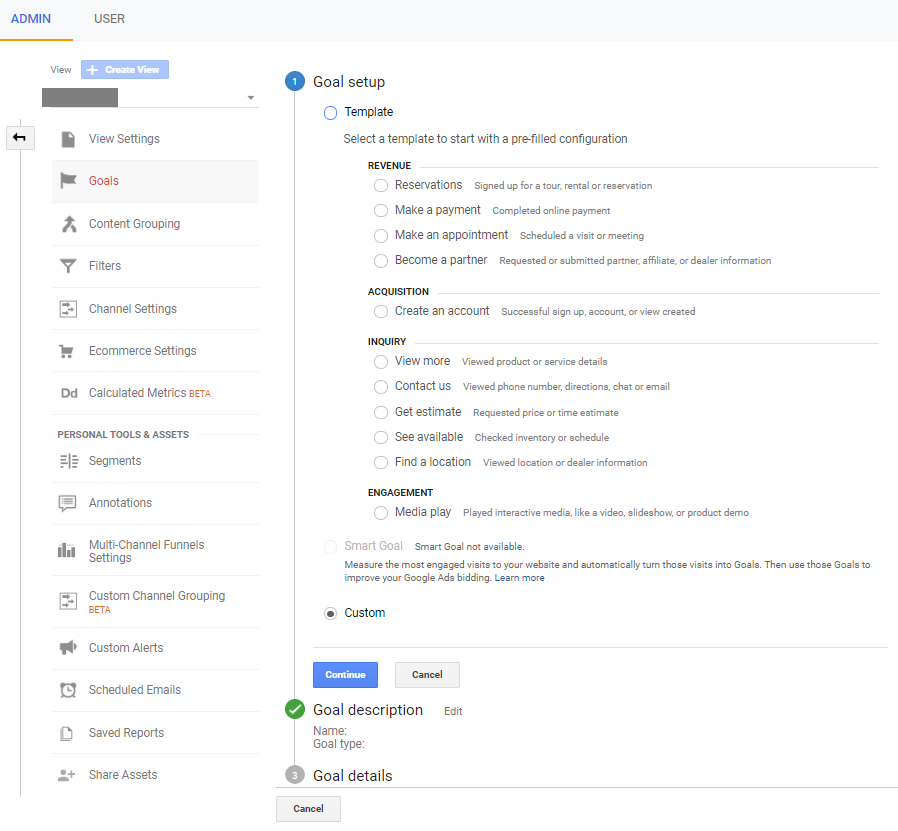
Now, as for conversion, you’ll be able to track how well your website converts. All you need to do is create goals in Google Analytics.
The goal is not limited to revenue only. It can be the number of people who engage by asking questions or it could be the number of people who create an account on your website.

2. Google Search Console (GSC)
The next free tool is Google Search Console. It is an amazingly powerful tool gives you a lot of information that you can act on. Ultimately, it helps to “make your site shine in Google Search results’, as mentioned on their page.
So, the most helpful information to me is the “Search results” tab. It tells you about the keywords people type in to find your website.
Not just those keywords, it also tells you how many people found you for that keyword, how many clicked when they found it, showing you the CTR for them.
I believe I’m just like other webmasters. I use them for keyword research and they work great. How?
Basically, I just compile a list of keywords bringing traffic to my site. Then, I find out the ones that I am getting impressions for but not clicks. The next step is to do On-Page optimization accordingly.
3. Google PageSpeed Insight
The third free and helpful tool is the Google PageSpeed Insight tool. As the name suggests, it gives you insight on your page speed, both on mobile and desktop devices.
Not only that, but it also provides you with a set of data and a list of suggestions to speed up the loading time of your website.
The speed of your page does affect SEO and user experience. Therefore, PageSpeed insight would be another tool that you would be using regularly.
4. Lighthouse

Lighthouse is a free tool by Google, created for Web Developers. It is an automated tool for improving the quality of web pages and it’s only available for Google Chrome.
Its audits identify and fix common problems that affect your site’s performance, accessibility, and user experience. You can audit for both mobile and desktop.
It has audits for
- Performance
- Progressive Web App
- Best Practices
- Accessibility
- SEO
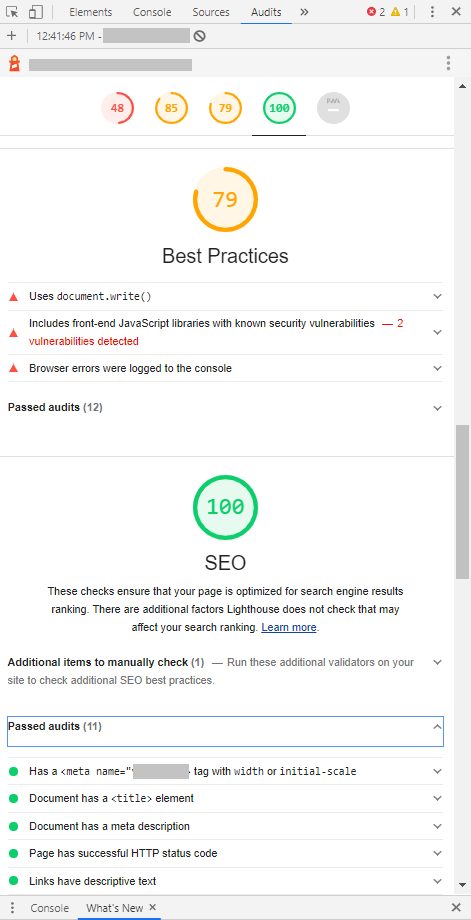
To give you a clearer picture on its audit, here’s one that I’ve generated:

The report tells you which part of your page needs improvement. Each audit is accompanied by a reference doc explaining why the audit is important, as well as how to correct it.
5. GDoc SEO Assistant
GDoc SEO Assistant is a helpful and free Google Docs add-on. It indirectly measures and affects your website performance.
GDoc SEO Assistant helps you optimize your content and measures real-time SEO Score for you.
Having a good SEO score is beneficial as it aims to assist you in improving your content.
What GDoc SEO Assistant mainly does is provide you real-time SEO suggestions and related keywords that come with data to make better SEO decisions.
These suggestions include:
- Reduce the usage of keywords in the anchored links.
- Simplify your content.
- Add keyword in the first 100 and last 100 words.
- Decorate your keyword to improve reading experience.
- More…
Conclusion
We’ve come to the end of the article. If you enjoyed reading this article and found this helpful, do bookmark it as I will be sharing more free tools with you all.
Know any other tools or metrics to measure website growth? Do share it with us!